Searching
There are two ways to search the data on the "Spinal Cord " site; “Gene Search” and “Advanced Search.”
Gene Search
“Gene Search” appears on our landing page. A gene search will show you a list of all the experiments we’ve done involving a gene that matches your search criteria. A “Match” in gene search means that the text you type in is contained somewhere in the name, symbol or alternate symbol of the gene involved in the experiment.
As you begin typing in the gene search box, a list of suggestions will appear. You can use your arrow keys or the mouse to move down, highlighting the desired entry. If you’re using your mouse, click on the desired entry to select it, then hit your “Enter” key or click the Search button to perform the search. If you’re using arrow keys, hit the “Enter” or “Tab” key to select the highlighted item. If you don’t want to use any of the suggestions, hit your “Esc” key or click your mouse outside the list and it will disappear.
Advanced Search
The Advanced Search page has many more options. You can:
- Use the check boxes to limit a gene search to any combination of gene name, symbol or alternate symbols.
- Search by EntrezGene ID, or by our internal Image Series ID.
- Search by specimen age.
Type-ahead suggestions will appear for the gene search and all of the ID entry fields. After selecting a suggestion, click the Search button or hit the Enter key to perform your search. As noted above, you can dismiss the list of suggestions by hitting the “Esc” key.
Search Results
The result set shows a collection of gene expression experiments.
Please note-- If you searched by gene, it may appear that some of the rows do not match your gene criteria. Keep in mind that by default all of the alternate gene symbols (which are not shown in the result list) are included in a gene search. To see the alternate symbols for a gene, click on the gene symbol in the result list. If you want to exclude alternate symbols from your gene search, try the Advanced Search page.
Expression charts

Each of our experiments is divided into 16 images, covering the length of the spinal cord. Each row in the result set contains a small expression chart that describes in which images expression was detected for the given gene. As shown in the example at left, each chart is divided into 16 bars, one for each image in the image series. If expression was detected in an image, its corresponding bar will be colored green. If no expression was detected, the bar will be colored white. If a section image is unavailable, its position will be colored black. The sections progress from rostral to caudal, reading left to right.
Expression Categories
This chart appears on the search results page and is meant to indicate membership in the various “expression enrichment” categories for each experiment.

A dark blue rectangle indicates membership in the corresponding category. The category positions are described below; you can also hover your mouse over a blue rectangle to show the category name.
- Laminae 1-3
- Laminae 4-6
- Laminae 7-8
- Laminae 9
- Intermediolateral Column
- Gray Matter
- White Matter
- Central Canal
- Ventral-dorsal Midline in Gray Matter
- Radially Arrayed in White Matter
- Vascular-like in Gray and White Matter
Sorting

The results are initially sorted by Gene Symbol in ascending order. Click on any of the column headers to sort by that column; click on the same column header again to reverse the sort order. A small arrow will appear next to the currently sorted column, indicating the sort order, as shown in the image at right.It is also possible to sort by expression position. In the expression chart illustration above, note the rectangular green blocks in the top row. Clicking one of these boxes will sort the results according to amount of expression in the corresponding area of the specimen. Each of the sort-boxes represents an area covering four images in the specimen. The first box (labeled “R” for Rostral) represents the four most-rostral images; the last box (labeled “C” for caudal) represents the four most-caudal images, and so on.
Getting more detailed information
The Gene Symbol links to detailed information about the gene in our experiments. The number in the “Images” column links directly to a contact sheet of all the images for the given experiment.
Comparing Result Sets
In addition to the links found in each experiment row, you can select multiple rows to compare side-by-side. Click the check box at the far left of the desired rows, then click the “Compare Selected Experiments” button. Use the check box in the column header to toggle all of the row check boxes on or off.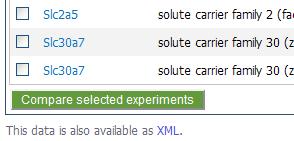
XML
As shown in the image above, at the bottom of the table there is a link to an XML document containing all of the data in the result set.