Hey there 
Thank you for the WHB atlas and the associated resources, they’ve been really useful!
I have isolated excitatory cortical neurons of interest from the atlas by supercluster ([‘Deep-layer near-projecting’, ‘Deep-layer corticothalamic and 6b’, ‘Upper-layer intratelencephalic’, ‘Deep-layer intratelencephalic’]). The next levels of annotations seem divided numerically (for example, within Deep-layer near-projecting we can find ‘DLNP_83’, ‘DLNP_91’, ‘DLNP_90’, ‘DLNP_94’, ‘DLNP_93’ etc). I was wondering whether there was a relatively straightforward way to stratify these superclusters by layer. For example, if we take clusters within the Upper-layer intratelencephalic supercluster (such as ‘ULIT_133’, ‘ULIT_134’, ‘ULIT_135’, ‘ULIT_138’), which of them are L2 IT or L3 IT? Likewise within the Deep-layer intratelencephalic, which clusters are L4 IT or L5 IT or L6 IT? Ideally, withouthaving to start the annotation from scratch? Somewhat like in the MTG snRNA-seq dataset https://www.science.org/doi/10.1126/science.ade9516. In other words, how can I subdivide the superclusters (or group the clusters) by anatomical layer.
Any info would be greatly appreciated.
Many thanks
Luke
Hi @marsdenl,
I’m glad to see you found these data useful! As far as I recall, this information was not provided in the original paper, as dissections were done per brain region, and the EEL-fish validation was primarily for subcortical structures.
Determining the cortical depth of cluster for WHB can be determined semi-quantitatively by taking advantage of the fact that many of the cells used in the MTG snRNA-seq dataset https://www.science.org/doi/10.1126/science.ade9516 (which we call the “great ape” or “GA” study) were also used in the WHB study, and therefore we have both sets of annotations for the same cells. So the first step to addressing your question is translating the cell types between studies, and we have a tool for that, called Annotation Comparison Explorer (or ACE).
If you go into ACE and set the configurations as follows, you can see the translations:
The results for the upper layer IT cells are shown below, but you can adjust the filter (arrow above) to do this comparison for any of the supertypes. Some of the cells are likely low quality (e.g., something called VLMC in one study and ULIT in another), but the vast majority should be good.
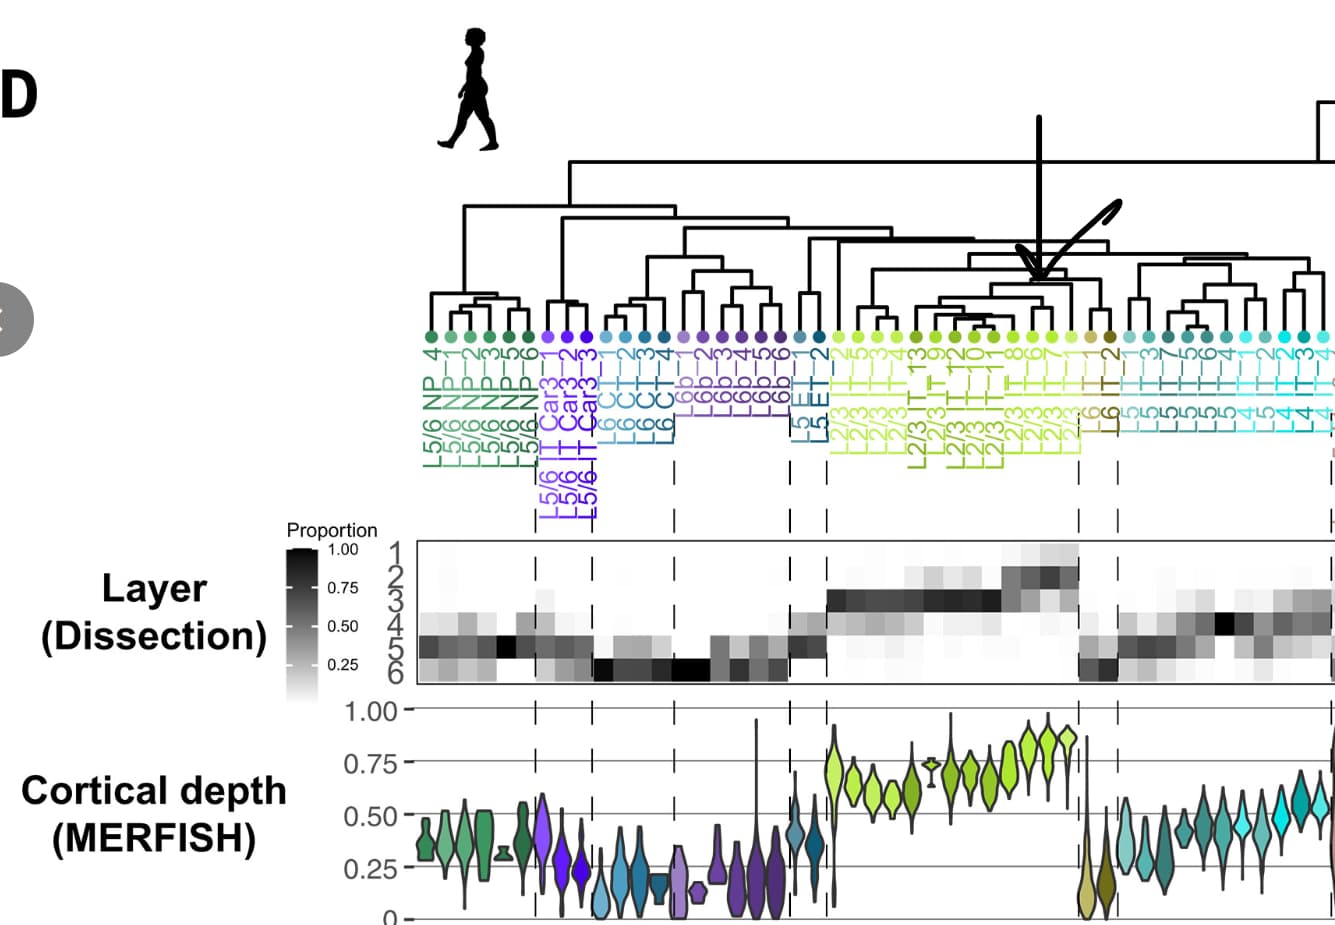
Once you have a particular cluster of interest (e.g., ULIT_121), you can see which GA_cluster it corresponds to (e.g., L23 IT_6), and then use Figure 1 from the great ape study to determine cortical depth (below):
The data behind the translation is available at the ACE GitHub repo (top URL within the app image shown above). Unfortunately, I did not encode the cortical layer information from the great ape study directly into this table (an oversight, which I’ll revisit when I get a chance!), but you could do this by joining supplemental tables from both studies. Let me know if you have any questions.
Best,
Jeremy
Once again, fantastic tool! Thank you so much for the detailed answer, that did the trick beautifully. Really happy, thanks Jeremy
I wanted to ask a follow up. Where did you say I could find the none normalised cortical depth for a given cell type for the GA study?
Thanks Jeremy
We don’t have non-normalized cortical depth, but we have something close. Both the SmartSeq and the 10X data used in the GA study comes from tissue dissections spanning separate cortical layers, so we should have a layer of origin for each snRNA-seq cell in the study. The results per cluster are summarized in Table S1 of the above study.
I’m not sure exactly which table has these values, but all the raw and processed data for the study is available on NeMO here ( NeMO Data Archive Assets ) and code for the analysis and generation of figures is available for download from https://github.com/AllenInstitute/Great_Ape_MTG.
Cortical depth was also validated using spatial transcriptomic methods (e.g., MERSCOPE), by mapping cells to clusters and then assessing cortical depth. I’m not sure exactly what format this is shared in.
That’ll do Thanks again Jeremy
Quick correction: only the SmartSeq data but NOT the 10X data comes from tissue dissections spanning separate cortical layers. The 10X data come from tissue dissections spanning the cortical depth. That shouldn’t impact your analysis outcomes, but I don’t want you searching for files that don’t exist!