Hi @marsdenl,
I’m glad to see you found these data useful! As far as I recall, this information was not provided in the original paper, as dissections were done per brain region, and the EEL-fish validation was primarily for subcortical structures.
Determining the cortical depth of cluster for WHB can be determined semi-quantitatively by taking advantage of the fact that many of the cells used in the MTG snRNA-seq dataset https://www.science.org/doi/10.1126/science.ade9516 (which we call the “great ape” or “GA” study) were also used in the WHB study, and therefore we have both sets of annotations for the same cells. So the first step to addressing your question is translating the cell types between studies, and we have a tool for that, called Annotation Comparison Explorer (or ACE).
If you go into ACE and set the configurations as follows, you can see the translations:

The results for the upper layer IT cells are shown below, but you can adjust the filter (arrow above) to do this comparison for any of the supertypes. Some of the cells are likely low quality (e.g., something called VLMC in one study and ULIT in another), but the vast majority should be good.

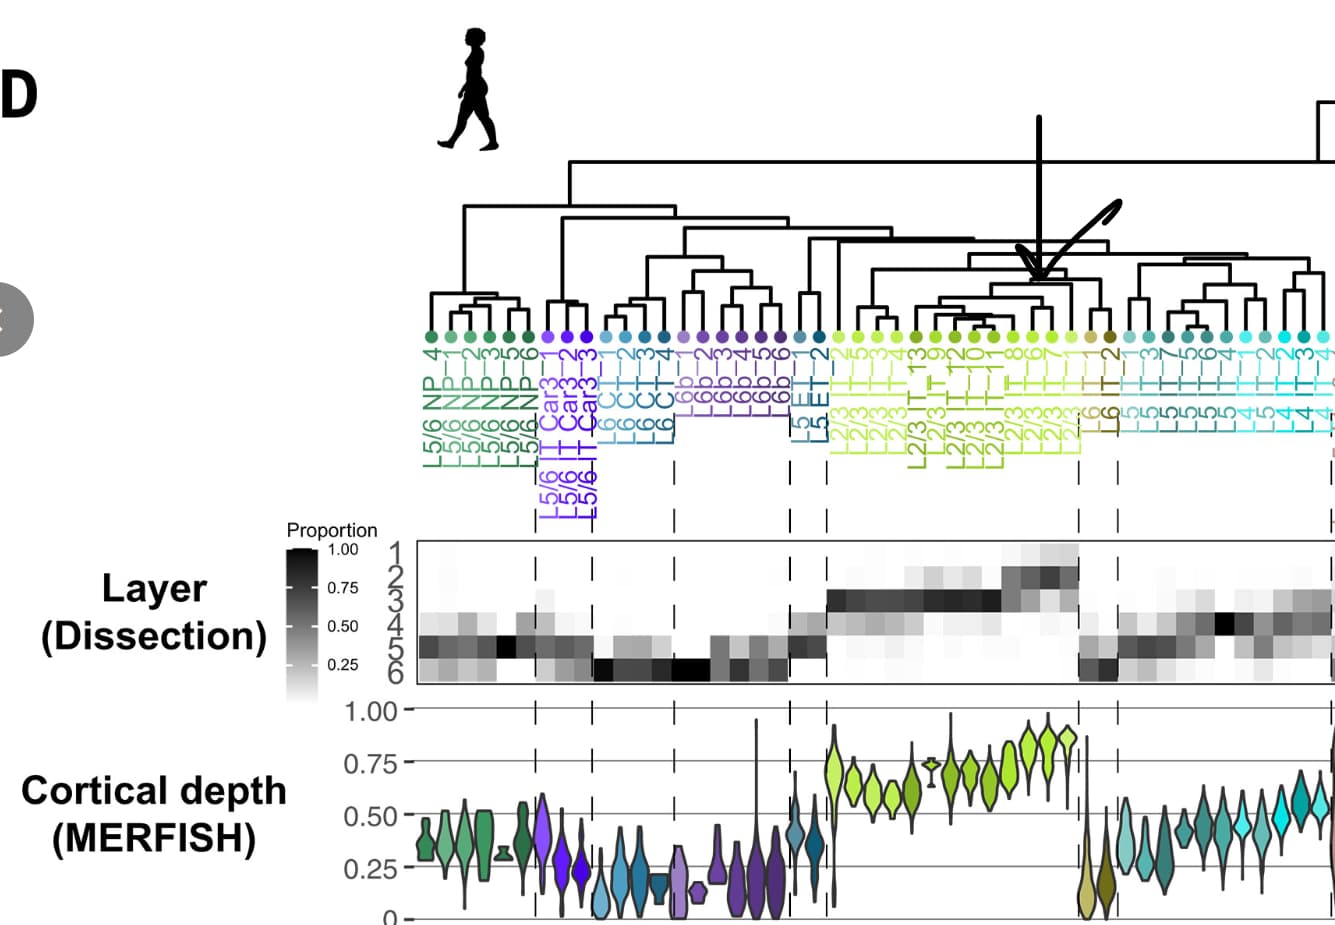
Once you have a particular cluster of interest (e.g., ULIT_121), you can see which GA_cluster it corresponds to (e.g., L23 IT_6), and then use Figure 1 from the great ape study to determine cortical depth (below):
The data behind the translation is available at the ACE GitHub repo (top URL within the app image shown above). Unfortunately, I did not encode the cortical layer information from the great ape study directly into this table (an oversight, which I’ll revisit when I get a chance!), but you could do this by joining supplemental tables from both studies. Let me know if you have any questions.
Best,
Jeremy