I’m trying to compare the transcript expression levels for specific genes of interest between the new Aligning Science Across Parkinson’s (ASAP) Parkinson’s Disease Brain Human Postmortem BrainSeq database and ABI’s transcript expression level analysis in healthy human brains. The ASAP database provides a nice 2D PCA analysis of cell types and brain regions, but I don’t see a comparable visualization output with ABI’s healthy human brain database. Any guidance for how to perform an apples-to-apples visualization comparison of target gene expression levels in different cell types / brain regions between these two databases would be greatly appreciated!
Hi,
ASAP-PMDBS cells were mapped to a healthy whole human brain (WHB) taxonomy (Siletti et al., 2023), which is hierarchical taxonomy of ~3.3 million cells (neurons and non-neuronal cells) with 31 superclusters, 461 clusters, and 3,313 subclusters spanning 105 anatomical dissections across the whole human brain. The 30 ASAP-PMDBS clusters were mapped at the WHB supercluster, cluster, and subcluster levels. Click on the hyperlinks to view the ASAP-PMDBS clusters in the Allen Brain Cell (ABC) Atlas side-by-side with the WHB neuronal and non-neuronal cells. Here you can also search for genes in the different datasets by clicking on the double helix on the lefthand panel.
If you have questions using the ABC Atlas, please check out the ABC Atlas User Guide.
Let me know if this is helpful or if you have further questions!
Hello Rachel,
Thank you for the quick response. However, I must be missing something because it’s still not clear to me how I would assess relative transcript expression levels in PD brain vs. healthy brain. For example, in the ASAP Human Postmortem-Derived Brain Sequencing Collection I can identify the expression level of ALOX15 transcript in different neuronal subtypes and brain regions:
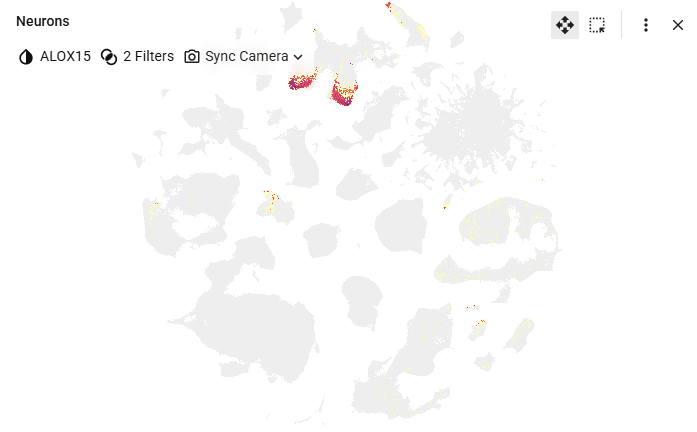
So can I do this same type of analysis and visualization in ABI’s scRNA-Seq transcript expression level analysis in healthy human brains?
Thanks again,
Sean