Clarifying how MMC reclassifies Allen reference cells

Hi everyone,

I’ve been working with the Allen reference dataset (Whole Cortex & Hippocampus - 10x Genomics (2020) with 10x-SMART-seq taxonomy [2021]) and using MapMyCells (MMC) to classify both my own snRNA-seq samples and, for consistency, the reference data itself.

Just to clarify: everything described here refers only to the reference dataset, no other samples are included in these steps or results.

Before running MMC on the reference data, I performed downsampling with the following filtering steps: I isolated cortical cells, filtered for GABAergic types, and separated SST and PV cells using string pattern matching based on “cell_type_alias_label” and related fields.
This already raised a first question: I ended up with almost twice as many SST-labeled cells as PV (43,681 SST vs. 28,971 PV), which surprised me. Based on the mouse lines and methods used in the original dataset, I wasn’t expecting such a strong SST enrichment. Does anyone have thoughts on this?

Continuing with the reference dataset: when running MMC on the SST group, I calculated the mismatch rate as described in the documentation and found only ~2% mismatch at the subclass or supertype level; so far, so good. However, I noticed this because I was trying to match MMC output labels back to the original Allen taxonomy, as used on the transcriptomics web portal, in order to later apply that structure when comparing to my own samples.
I was specifically trying to compare the annotations of the same cells before and after running MMC, in order to understand how MMC reassigns their identity and how that aligns with the original taxonomy.

Here’s where things got a bit confusing (again, still working only with the reference dataset after MMC mapping):
Some cells labeled as “100_Sst” in “cell_type_alias_label” are reassigned by MMC to multiple subclass names, including: “053 Sst Gaba”, “056 Sst Chodl Gaba”, “052 Pvalb Gaba”. In more extreme cases, cells labeled “74_Sst” are reassigned to as many as seven different subclass names, including PV and non-cortical types.

I’d appreciate any advice or clarification on: whether there’s a recommended approach to align MMC subclass labels with the original Allen taxonomy, or whether these should be treated as distinct classification systems, and direct mapping is not expected

Thanks in advance! It’s been great to use MMC, and I’d really appreciate any insights that could help me interpret these results more confidently.

Best,
Rebeca
Hi @RebecaO

I know we’ve been conversing in a back channel discussion, but I just want to get some more explicit information before figuring out which of my colleagues to ping about this.

It sounds to me like you are taking data that was aligned to an older Whole Mouse Brain taxonomy, running it through MapMyCells, and comparing the annotations in the older taxonomy with the results from MapMyCells (which will be phrased in terms of the taxonomy introduced in Yao et al. 2023). I say this because I do not think “100_Sst” and “74_Sst” are annotations that are used in the Yao et al. taxonomy. I could be wrong, though.

Can you post a link to

a) where you downloaded the data you are running through MapMyCells
b) the taxonomy you are comparing against (what you refer to as the “original Allen taxonomy”).

I just want to make sure what you are seeing isn’t the result of mapping “Allen Institute understanding of the Whole Mouse Brain circa 2023” with “Allen Institute understanding of the Whole Mouse Brain circa 2020”.

Thanks,

Scott

Sure, Daniel!

This is the website I am talking about: Cell Types Database: RNA-Seq Data - brain-map.org
In this website you have the data to download it. I used: “Whole Cortex & Hippocampus - 10x genomics” (2020) with 10x-SMART-seq taxonomy (2021). I downloaded those data and I am trying to compare them with the “Explore and analyze” section, same dataset with 2 different forms of seeing the data. The paper is from Yao et al, but 2021, instead of 2023. This is what I mean as “the original Allen taxonomy”.

When looking at those data, with no processing made, there are columns with the annotations I said, and then, after running those data through MMC, I tried to match those annotations to MMC ones.

I hope this helps to understand what I am doing better.

Thank you for your time!

Hi @RebecaO,

I’ll defer to Scott about mapping your data to the mouse cortex + Hippocampus taxonomy (Yao et al, 2021), but I did want to mention two things.

First, the taxonomy itself is available in a format more accessible to cell type mapper here: AllenInstituteTaxonomy/taxonomies.md at main · AllenInstitute/AllenInstituteTaxonomy · GitHub (second row from the bottom of the table).

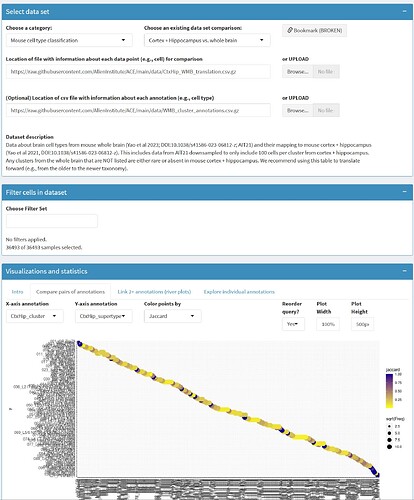
Second, Annotation Comparison Explorer (ACE) has a way of visualizing (see below for proper configuration of app) and computationally comparing cell types from these two taxonomies (using data in top link in the image below):

I just posted a longer post about ACE earlier today if you want more details.

Best,
Jeremy

Hi, Rebeca

Ambiguity at cluster level is unfortunately unavoidable, as we performed clustering in high dimensional space where cell types are defined by combinatorial markers with gradient expression change. Particularly in Sst subclass, except for distinct cell types such as Sst Chodl, each cluster might have multiple neighboring clusters, with transition cells located at each transitional zone. Small changes, such as including more or fewer cells, slightly change of parameters, genes used for clustering, or by completely stochastic process, may cause different clustering results. That’s why we believe cell type hierarchy is very important. Despite of uncertainty at single cell level, you can still largely draw correspondence between CTX/HIP taxonomy and WMB taxonomy, e.g. 100_Sst in CTX/HIP roughly correspond to 0795 Sst Gaba_8 in WMB atlas. Clusters at the finest level usually reveal the axes of the gradients, but it is very challenging to cut these gradients consistently. The tool that Jeremy mentioned, and hopefully more to include in our further release, can help visualization of the correspondence between different version of the taxonomy with greater transparency.